The Client Analytics page in Lifecycle Manager shows your service performance, customer satisfaction, and ticket activity in one place.
It uses:
- Ticket data from your PSA integration (ConnectWise Manage, Autotask or Halo PSA).
- Customer Satisfaction (CSAT) results from CrewHu.
Who can use this feature?
Partners with Lifecycle Manager X features enabled for a client
Before you begin
To use client analytics, you'll need the following integration types connected and set up correctly in the integrations center:
- A PSA integration (ConnectWise Manage, Autotask or Halo PSA) with ticket mappings configured
- A CSAT integration (CrewHu or Simplesat)
Related articles
- Integrating with ConnectWise Manage
- Autotask PSA Integration instructions
- Integrating with Halo PSA
- Integrating with Microsoft 365 (Multi-Tenant)
- Integrating with Crewhu
- Integrating with Simplesat
Mapping tickets from your PSA (Click to expand)
For Analytics to be able to use ticket data for reporting, you will first need to make sure that the ticket types are mapped correctly.
To do this, navigate to your PSA integration's settings page:
- Hover over settings
 , and click Integrations.
 - Click the name of your PSA integration.
- Scroll down to Tickets (If this section is unavailable, make sure that your integration permissions allow for syncing tickets)
Ticket Statuses
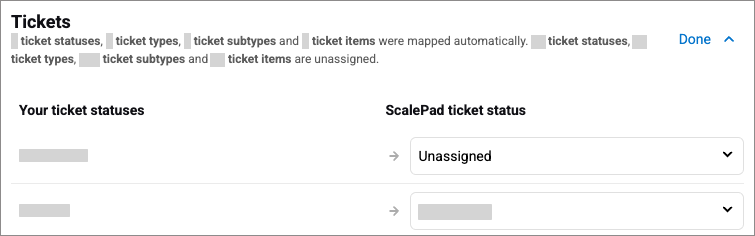
After your first sync, ticket statuses will be visible in the Tickets section. Map each of Your ticket statuses (left column) to a ScalePad ticket status using the dropdown menu on the right.
Ticket Categories
Assign a ScalePad category level to the Ticket Type, Subtype and Item fields syncing from your PSA.

Depending on how you use types, subtypes and items in your PSA, you can assign them to Level 1. Level 2, or Level 3 categories. Category options become more specific at higher levels:
- Level 1 Category: General tickets.
Example: Incident resolution - Level 2 Category: More specific options than Level 1.
Example: Network Incident - Level 3 Category: The most specific ticket types.
Example: Firewall Incident
The level you choose for each field determines which ScalePad options you can map to each ticket type.
Note: While assigning at least a Level 1 category is important, if your PSA setup doesn't use more granular options, you can choose not to use the Level 2 or Level 3 categories for mapping.
Note
- Depending on the number of tickets in your PSA, the initial sync can take 24-48 hours.
- Ticket and time entry data is limited to the past two years.
Overview of Client Analytics
To open analytics for a specific client:
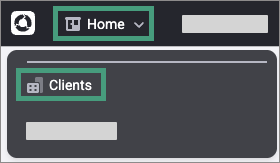
- Hover over Home in the top navigation menu and click Clients.
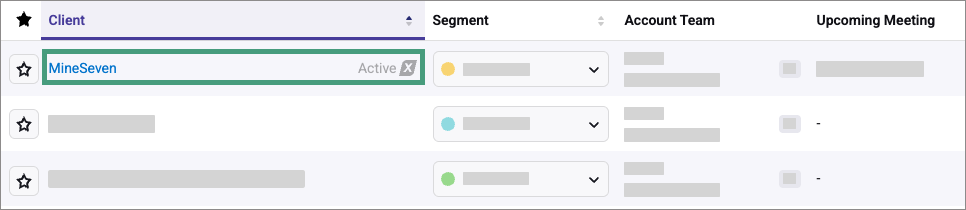
- Select a client with Lifecycle Manager X enabled.
- In the left menu, click Analytics.

When you open the client analytics page, you will see three tabs at the top of the page:

- Dashboard: High-level ticket and satisfaction metrics, plus data reliability
- Service Quality: Detailed ticket volume, resolution, and workload metrics
- Customer Experience: Satisfaction survey results and response distribution
Click a tab to switch between views. The data and filtering options will update based on the selected tab.
Dashboard tab
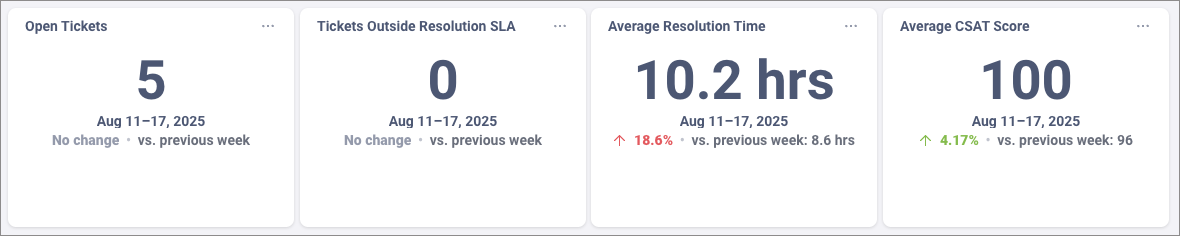
Shows high-level ticket and CSAT metrics with a confidence rating for data accuracy.
Filtering options
- Category: Filters results by ticket category from your PSA
- Board Name: Filters results by the service board from your PSA where the ticket is assigned

Overview data
| Open Tickets | Number of unresolved tickets. |
| Tickets Outside Resolution SLA | Tickets not resolved within your Service Level Agreement (SLA), the agreed time within which a ticket should be resolved or responded to. |
| Average Resolution Time | Average time taken to resolve tickets. |
| Average CSAT Score | Average satisfaction rating from completed tickets. |
Dashboard Health
Ticket Status Confidence measures the accuracy of ticket status mappings from your PSA integration.
- Confidence rating: Displays as High, Medium, or Low.
- Reason: Explains why the rating is at its current level (for example, "More than 30% of tickets are unassigned").
- Action: Suggests steps to improve accuracy, such as reviewing your mappings in the ScalePad Integration Centre.
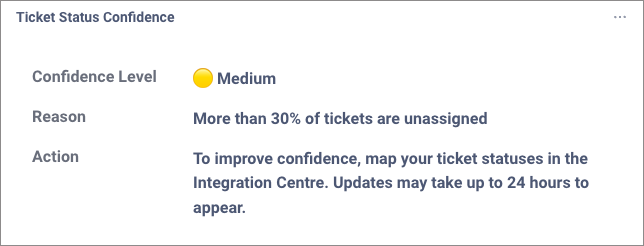
Low or medium confidence means other ticket metrics may be unreliable until mappings are corrected. Changes appear after your next integration sync.
Related article
- Mapping ticket statuses in the Integration Center
Service Quality tab
Provides detailed analytics for ticket volumes, resolution times, and workload distribution.
Filtering options
- Date: Select the reporting period.
- Category: Filters results by ticket category from your PSA.
- Board Name: Filters results by the service board from your PSA.
Service quality panels list
Service quality data is displayed in panels, which are outlined below.
Data from any panel can be downloaded by clicking the context menu icon  in the upper right of each panel and choosing the Download results option.
Ticket Performance
| Panel | Description |
| Tickets Created & Closed | Bar chart of total tickets opened, with a line chart of total tickets closed. |
| Tickets Created by Contact | Number of tickets grouped by the contact who created them. |
| Tickets Created by Category | Number of tickets created based on the creation date, grouped by category. |
| Tickets Created by Board | Number of tickets created based on the creation date, grouped by board name. |
| Open Tickets | Total open tickets over time, based on creation date. |
| Open Tickets by Status | Total open tickets grouped by current status, based on creation date. |
| Open Tickets by Category | Total count of open tickets grouped by category. |
| Open Tickets by Board | Total count of open tickets grouped by board. |
SLA Performance
| Panel | Description |
| Ticket Response Metrics | Line chart showing average first-response time and tickets breaching response SLA. |
| Ticket Resolution Metrics | Line chart showing average resolution time and tickets breaching resolution SLA. |
| Average Resolution Time by Category | Average resolution time grouped by category. |
| Average Resolution Time by Board | Average resolution time grouped by board. |
| Ticket Age By Created At | How long tickets have been open, grouped by creation date and sorted into four groups. |
| Stale Tickets by Last Updated | How long since tickets were last updated, sorted into four groups. |
| Long Tickets | Line chart showing long-running tickets over time. |
| Long Tickets by Category | Long-running tickets grouped by category. |
| Tickets Waiting | Total count of tickets in a waiting status, based on creation date. |
| Tickets Waiting by Status | Tickets waiting for client or vendor. |
Effort Performance
| Panel | Description |
| Tickets Per Seat | Tickets per licensed Microsoft user. |
| Hours Worked | Total hours logged over time. |
| Hours Per Seat | Total hours worked divided by the number of Microsoft 365 licensed users, showing average workload per seat. |
Note
Tickets per seat and hours per seat use your Microsoft 365 licensed users as the seat count, not PSA contacts, because contact lists often include non-staff records (vendors, billing, former employees). This makes the "per seat" metric a more accurate view of service load.
Customer Experience tab
Summarizes customer satisfaction survey results.
Filtering options
- Date range: Select the reporting period
Customer Experience KPIs
- Average CSAT Score - Shows the average CSAT score for the selected clients and Date range.
- Total Responses - Shows the total number of CSAT responses collected for the selected clients and Date range.
- NPS Score - Net Promoter Score from Simplesat surveys, based on how likely clients are to recommend you. (Only available with a Simplesat integration)
CSAT Performance
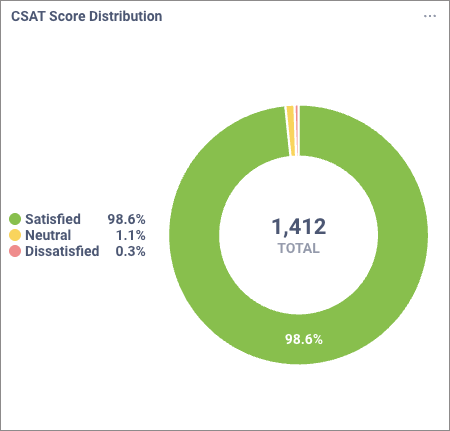
- CSAT Score Distribution - Shows the percentage of satisfied, neutral, and dissatisfied responses and the total number of responses collected.
- Survey Results - How many responses were satisfied, neutral, or dissatisfied, along with your average CSAT score over time.
NPS Performance
- NPS Rating Breakdown - Shows the distribution of survey responses by Promoters, Passives, and Detractors. (Only available with a Simplesat integration)
Client Engagement tab
The Client Engagement tab shows how actively your client is engaging with you through meetings, initiatives, and goals.
Use the Date and Time Grouping filters to focus on specific time periods.
Client Engagement KPIs
- Total Meetings
Shows the total number of client‑facing meetings in the selected Date range. - Last Meeting Date
Shows the date of the most recent meeting with the client. - Initial Approval %
Shows the percentage of new initiatives that clients have initially approved in the selected Date range. - Goal Attainment
Shows the percentage of client goals marked as achieved, helping you track progress against agreed success plans.
Initiatives and meetings
These panels break down initiatives and meetings to show where effort is focused and how engagement is distributed.
- Initiative by Priority
Groups initiatives by priority level to show where your teams are focusing their effort. - Initiative by Status
Groups initiatives by status to show progress across planned, in‑progress, and completed work. - Initiative Adoption
Shows how widely initiatives are being adopted across clients, helping you identify where additional rollout or coaching may be needed. - Meeting Types by Timeframe
Groups meetings by type over the selected Date range to show how engagement time is spent (for example, strategic reviews versus tactical sessions).
Any questions?
Reach out to our Lifecycle Manager support team by submitting a support ticket.
:sparkles: NEW :sparkles: Join our MSP Power-Ups
Free 15-minute micro-workshops + live Q&A with our Lifecycle Manager experts. Sign up here to reserve your spot.